
The only SFA-DMS built to execute your sales goals
Traditional SFAs give you just data. BeatRoute’s Goal-Driven AI ensures your business strategy gets executed by your sales team and channel partners.
⊢Trusted by Category Leaders Worldwide⊣


Our customers have specific business goals, and we help them achieve those with our tech.

Run Route-to-Market of 30+ brands with high efficiency & productivity
30%
Higher Sales Productivity

Grow sales by improving engagement with retailers and mechanics, together
3X
Customer Connect

Increase market coverage without increasing the cost of serving retailers
15%
Increase in Outlets Served

Unlike traditional SFAs & development platforms, BeatRoute is ready to deploy even for complex use cases.
Any changes, done from the Brand Panel itself in a few clicks.
Sales Force Automation Software (SFA)

Distributor Management System (DMS)

Retailer & Influencer App

Zero-Code Platform
Quick to Deploy and Highly Configurable. You can fully customize it to your needs.
BeatRoute Matrix
Low-code Integration with 300+ Apps · Compatible with all APIs.

BeatRoute's AI agents are built to drive your specific goals
Not generic copilots — purpose-built agents that take action on the ground, each pointed at a measurable outcome.
Scheduling AI Agent
Prioritizes the right outlets at the right time to eliminate unproductive visits.
See it in action →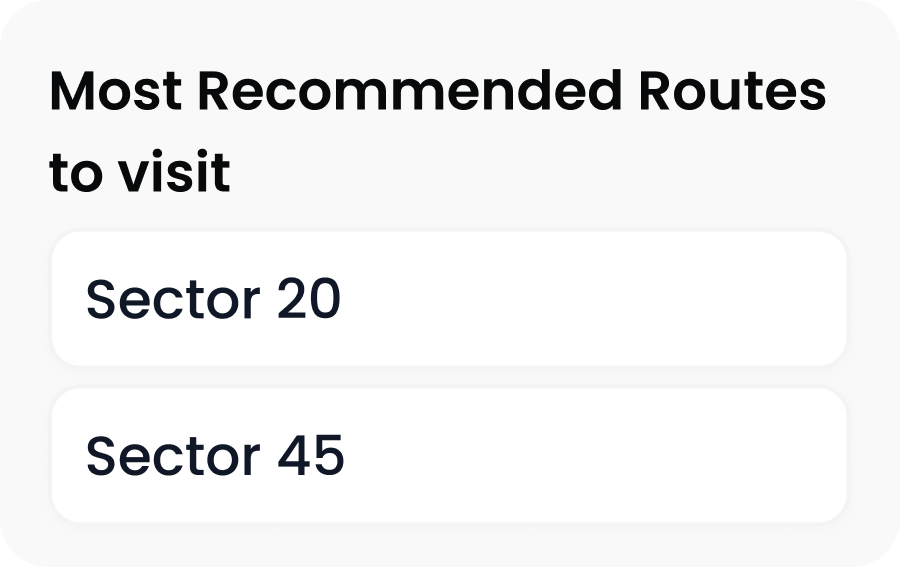
Order AI Agent
Recommends replenishment and new SKUs to increase AOV and range sold.
See it in action →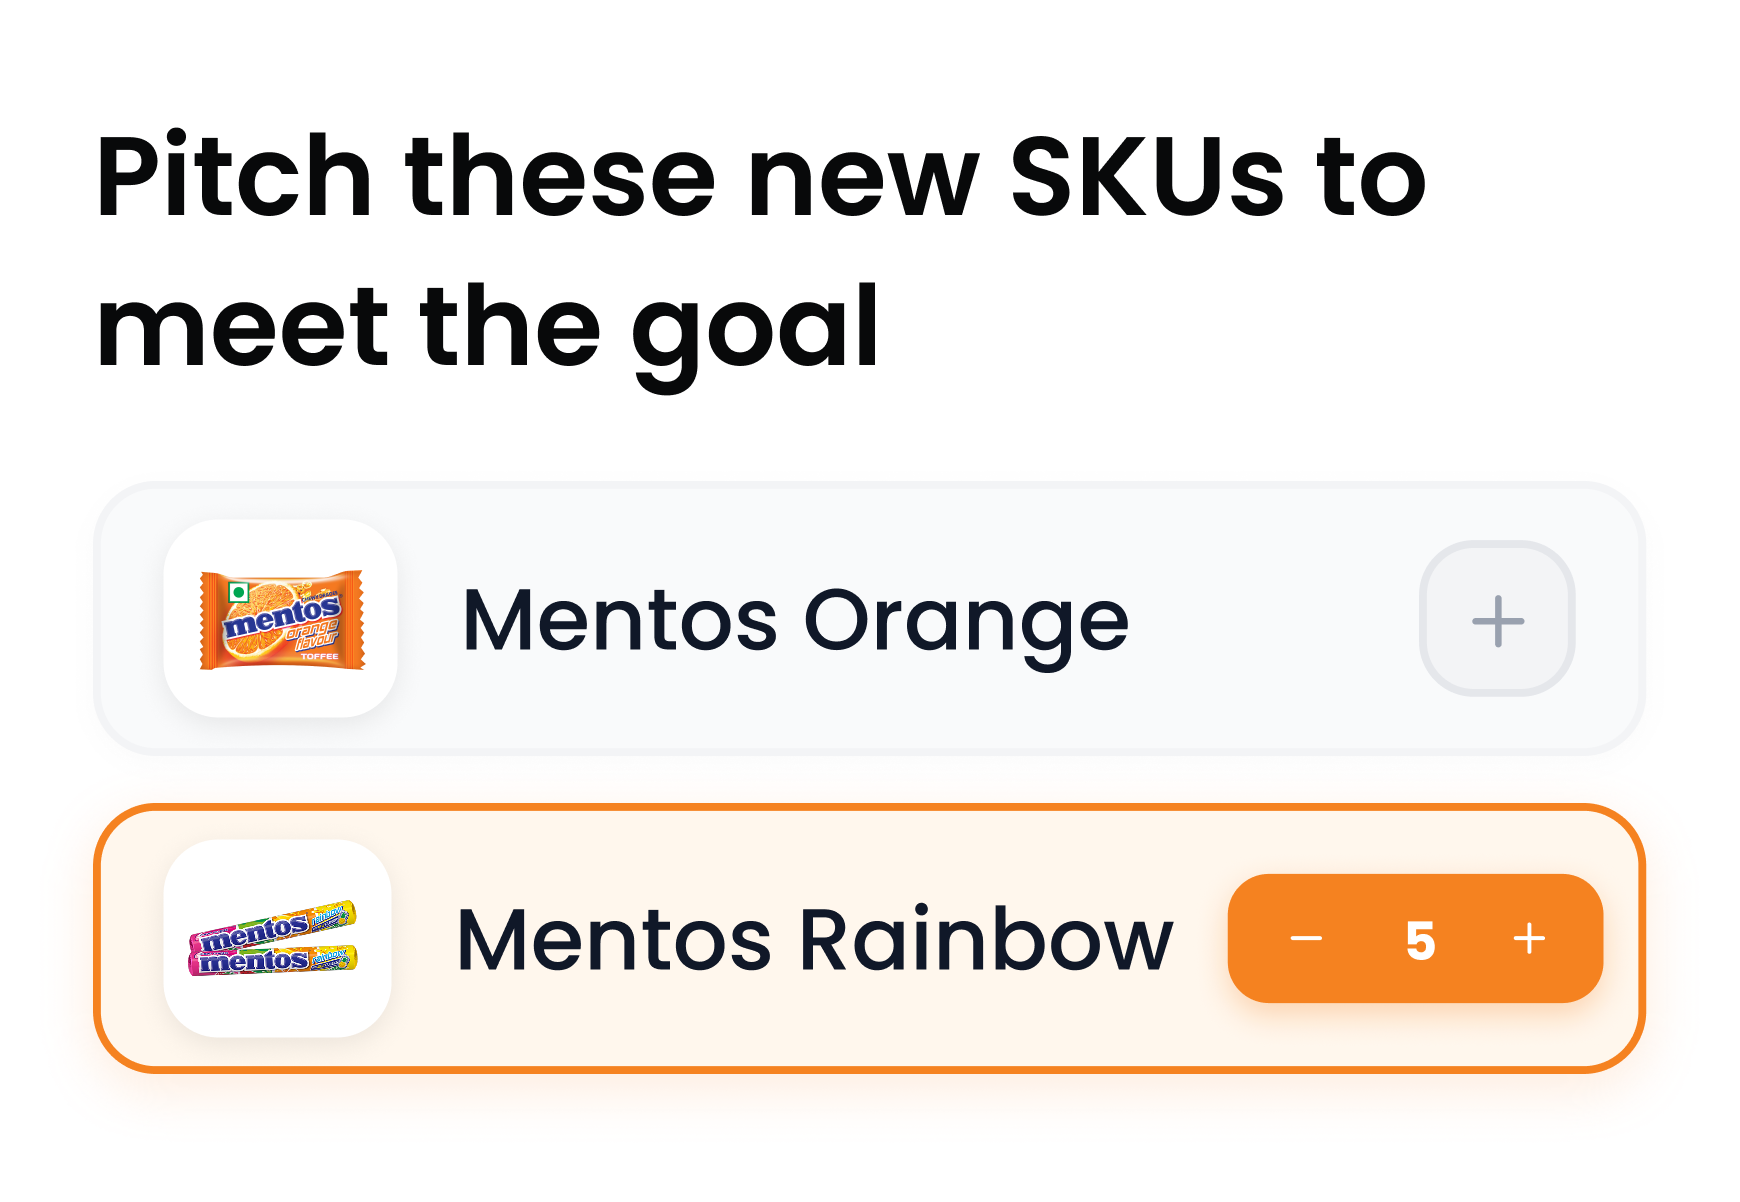
BeatRoute Copilot
Enables your territory managers to ask questions, get insights, and trigger actions — like scheduling visits — directly from chat.
VM Audit AI Agent
Converts shelf photos into share-of-shelf, planogram compliance, and competitor benchmarks instantly.
See it in action →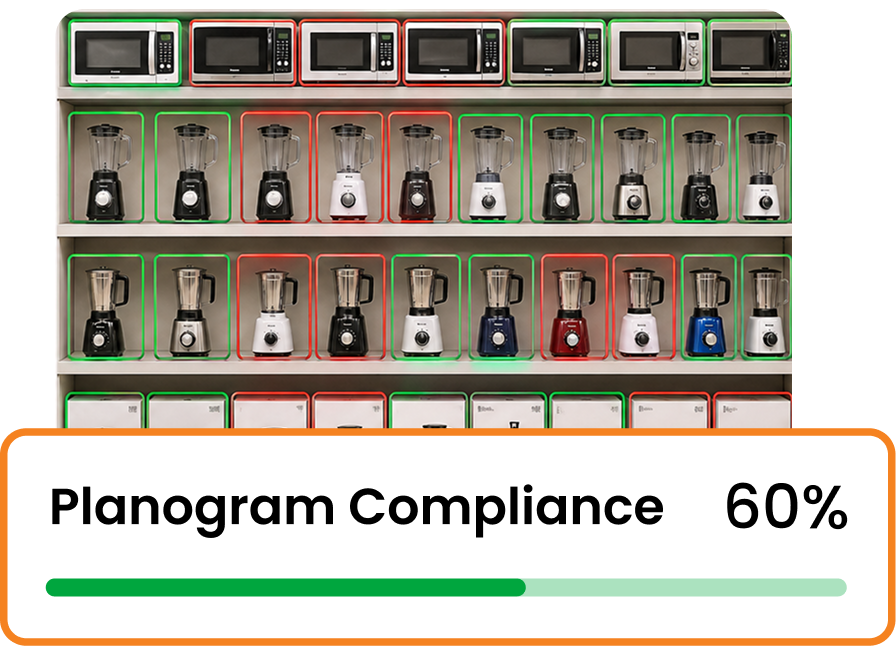
TeleOrder AI Agent
An AI voice agent that talks just like a human and calls retailers to capture orders in their local language.
See it in action →
“नमस्ते! क्या मैं आज का ऑर्डर ले सकता हूँ?”
+ 2 cases capturedExplore by industry
Pre-configured for the realities of how each industry sells, from GT and MT to dealers and influencers.


Latest from BeatRoute

How to Use AI Agents for Retail Distribution
Live demo of BeatRoute's AI Agents — driving orders, growing retailer business, and closing orders even with manpower constraints.

AI ROI Calculator
Estimate the revenue lift and productivity gains BeatRoute's AI Agents deliver to your sales and distribution motion.

